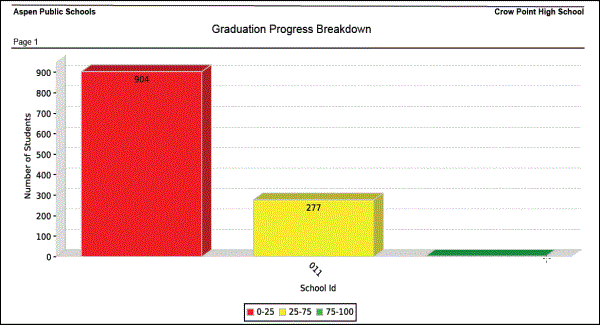
The Graduation Progress Chart report displays a bar graph showing the percentage of students who have met the requirements for a program of study:

The report shows a bar that indicates the number of students who have fulfilled one of the following percentage ranges for the program of study and requirement you selected:
- 0-25 (red)
- 25-75 (yellow)
- 75-100 (green)
The report also contains a table that analyzes the data in the graph.
To run the Graduation Progress Chart report:
- Log on to the School view.
- Click the Student tab.
- On the Reports menu, click Graduation Progress Chart. The Graduation Progress Chart pop-up appears.
- Use the following table to enter information in the fields:
-
Field
Description
School
The school you are logged onto appears.
School year
Click the
 to select the school year you want to run the report for.
Program of Studies
Click the
 to select a specific program of study.
Requirement
If you want to run the report for a specific requirement only, click the
 to select the requirement.
Students to include
Select one of the following to determine the students that appear on the report:
- All
- Current selection
- YOG
Search value If you selected YOG at the Students to include field, type the year of graduation you want to include on the report. Exclude 9th grade
Select this checkbox to exclude any students in Grade 9 from the report, because ninth graders often have a low number of requirements fulfilled. Include schools
Select one of the following:
- All
- School level: Type the level in the Search value field.
- School type: Type the type in the Search value field.
Search value
If you select School level or School type, type the specific value. Break school in graph by
Select if you want to break the graph by one of the following:
- School level
- School type
Recalculate history Select this checkbox if you want the report to recalculate the values for the graph. Otherwise, Aspen uses the data last compiled for the Graduation Progress report. Format Select the format in which you want the report to appear.
- Click Run. The report appears with the information you selected.
